
Get insights like this delivered to your inbox
Join 2,500+ GTM professionals. No spam, unsubscribe anytime.
Subscribe to NewsletterMiddleware monitoring is critical for SaaS companies aiming to scale efficiently while maintaining reliability. It ensures smooth operations by tracking and analyzing the software layer connecting applications, services, and databases. Here's why it matters:
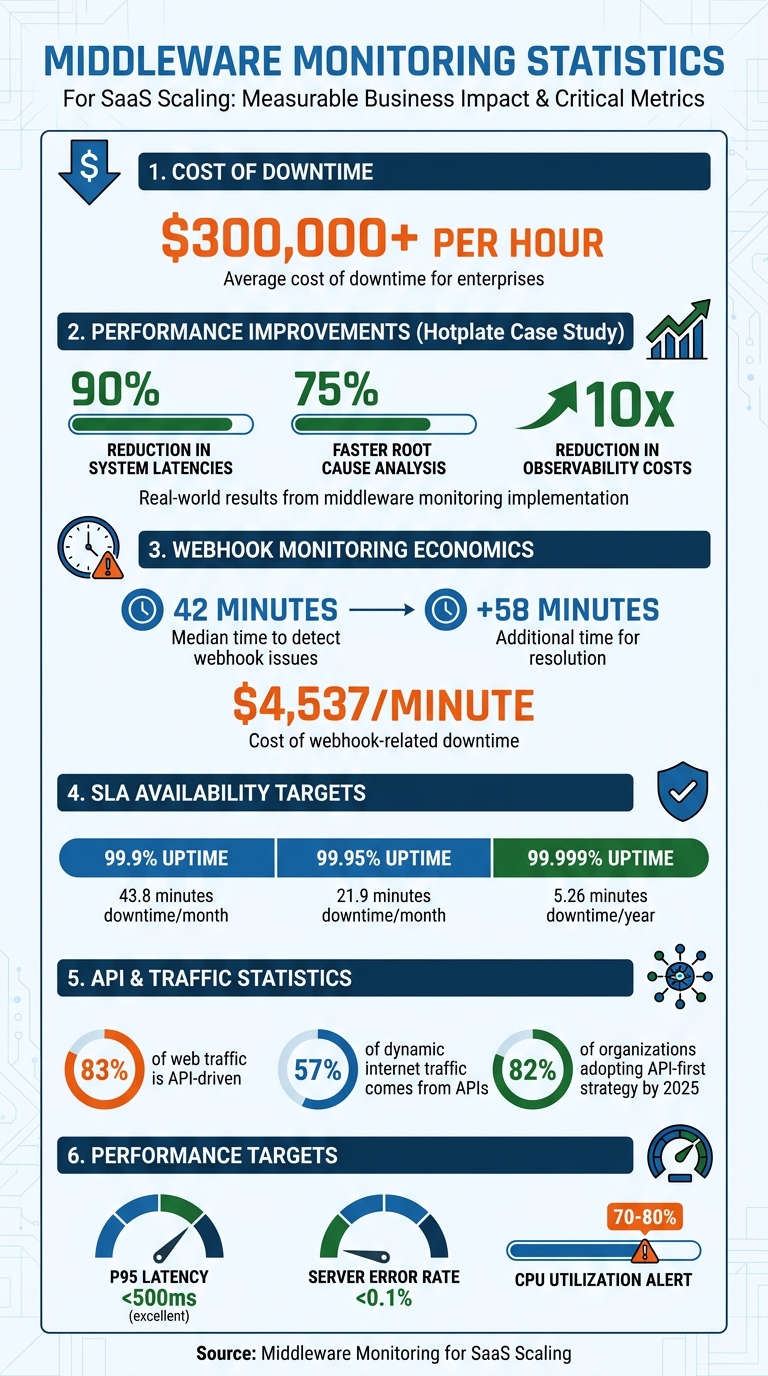
- Prevents Downtime: Downtime costs can exceed $300,000 per hour. Middleware monitoring detects issues like API failures or memory leaks before they escalate.
- Improves System Reliability: Combines logs, metrics, and traces into a unified view, enabling faster anomaly detection and resolution.
- Enhances Performance: Distributed tracing pinpoints delays in requests, while real-time analytics help optimize resource use.
- Reduces Costs: Avoids unnecessary cloud expenses by identifying inefficiencies, like infinite retry loops or API overuse.
- Supports Multi-Tenant Systems: Tracks tenant-specific performance to prevent high-value customer churn.
Middleware monitoring shifts teams from reactive troubleshooting to proactive management, ensuring SaaS platforms scale without compromising user experience or reliability.
Middleware Monitoring Impact: Key Statistics for SaaS Scaling
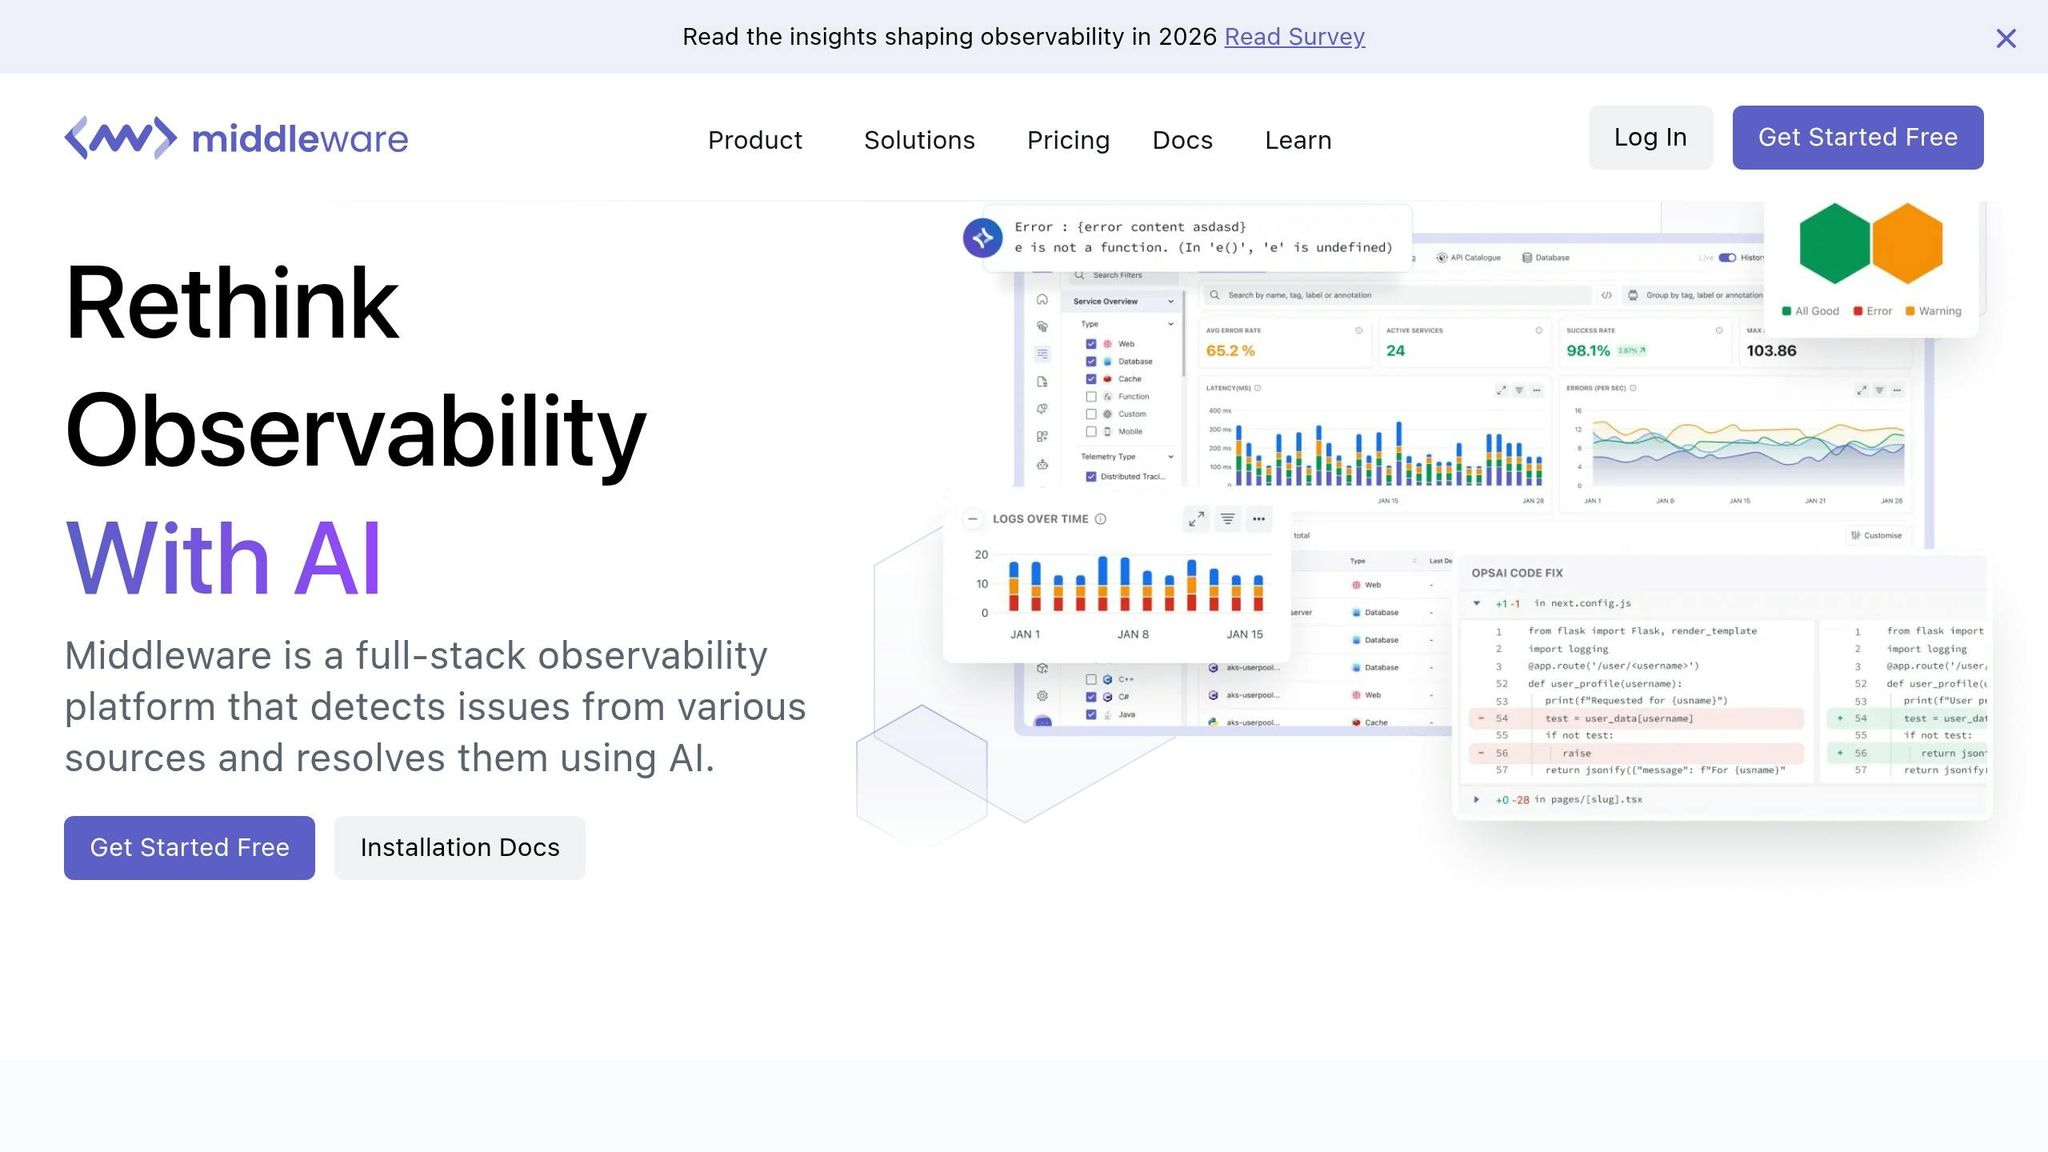
Middleware Observability Demo
sbb-itb-69c96d1
How Middleware Monitoring Improves System Reliability
Middleware monitoring provides a clear, unified view of your system by combining logs, metrics, and traces into a single timeline. This approach eliminates the need to juggle multiple tools, allowing teams to see the full picture of an incident. Lightweight agents collect host-level metrics - like CPU usage, memory, disk activity, and network data - every 10 seconds, offering an up-to-date snapshot of system health. This consolidated view sets the foundation for detecting anomalies early, addressing potential problems before they affect users.
The standout feature of middleware monitoring is its ability to detect anomalies proactively. AI-driven systems learn what "normal" looks like for your environment and flag unusual patterns, such as sudden spikes in network traffic or unexpected error rates, before users are impacted. For instance, your service might show a healthy 99% success rate overall, while a critical /checkout endpoint silently fails for every user.
Middleware monitoring also keeps tabs on infrastructure dependencies like database connections, message queues, and external APIs. This helps prevent cascading failures - such as a delay in an authentication service causing timeouts in payment processing or checkout services. Real-time monitoring adds an extra layer of safety during deployments by identifying issues like error spikes, inefficient database queries, or misconfigured environment variables as soon as new code goes live. This enables teams to roll back problematic changes quickly, shifting the focus from reactive troubleshooting to proactive system management, often requiring expert technical consulting to implement effectively.
Finding and Fixing Performance Bottlenecks
Distributed tracing is a powerful tool for tracking the complete lifecycle of a request, pinpointing exactly where delays occur - whether it's in your database, a third-party API, or internal processes. This level of detail helps uncover latency and response time issues. Monitoring high P95 or P99 latency is especially important, as these metrics reflect the experience of your slowest 5% or 1% of users. A P95 latency under 500 milliseconds is generally considered excellent for real-world performance.
In April 2026, Hotplate - a platform for pop-up chefs - struggled with performance bottlenecks during traffic surges. After adopting Middleware's observability platform, founding engineer Rangaraj Tirumala reported a 90% reduction in system latencies and a 75% faster root cause analysis of incidents. The platform also cut observability costs by a factor of 10.
Middleware monitoring can also identify integration failures that lead to cascading issues. For example, a delay in one service might trigger timeouts in others. Tools that monitor API rate limits - such as "429 Too Many Requests" errors - help prevent these issues. Providers like Salesforce enforce 24-hour rolling limits using a REQUEST_LIMIT_EXCEEDED signal, while Shopify uses a leaky bucket model with X-Shopify-Shop-Api-Call-Limit headers to manage requests.
Centralizing logs and metrics into a single platform significantly reduces the Mean Time to Recovery (MTTR). By correlating errors with performance data on one timeline, teams can skip the time-consuming process of switching between tools and focus directly on resolving issues. While tracing and debottlenecking improve performance, early error detection is key to maintaining continuous uptime.
Preventing Downtime with Early Error Detection
Spotting errors early is crucial for reducing both Mean Time to Detect (MTTD) and Mean Time to Recovery (MTTR). Traditional monitoring may overlook critical failures, as overall service health can appear fine while specific endpoints are completely broken.
Alert systems are designed to catch these "silent failures." For example, the median time to detect a webhook issue is 42 minutes, with resolution taking an additional 58 minutes. Considering webhook-related downtime can cost $4,537 per minute, early detection can save significant time and money.
Anomaly-based alerting goes beyond basic static thresholds (like "CPU > 80%") by using AI to learn normal system behavior and flag subtle deviations in error rates or traffic patterns. For mission-critical systems, shorter polling intervals - around 15 seconds instead of the standard 1-to-5-minute windows - can catch issues like CPU spikes or memory leaks even faster.
In November 2024, Irish Rail experienced a major website outage that left travelers in Dublin and Louth unable to book tickets or check schedules during the busy holiday season. This incident highlighted the importance of proactive observability for managing complex microservice architectures during peak demand.
"Middleware transformed our observability practices. In the brief time we have spent on the platform, it has made bug resolution more efficient and proactive."
– Akshat Gupta, Trademarkia
Real-time monitoring also helps catch deployment-specific issues - such as 500 (Internal Server Error), 502 (Bad Gateway), and 504 (Gateway Timeout) errors - immediately after a new code push. This allows teams to roll back problematic deployments before they affect users. Additionally, monitoring third-party API issues, like rate limits or silent webhook drops, is essential. These problems are often quiet but can have a major impact on the reliability of SaaS platforms.
Core Monitoring Features for Scaling SaaS Operations
Middleware monitoring tools need specific features to keep up with growing SaaS platforms. For platforms aiming for rapid growth, these tools are critical to maintaining performance as demands increase. The right features turn raw telemetry into actionable insights, helping prevent outages and support scaling. Two key capabilities stand out: real-time analytics with centralized logging and distributed tracing combined with intelligent alert systems. Together, these features provide the visibility and responsiveness needed to maintain reliability during expansion. They go beyond proactive monitoring to enhance scalability and performance.
Real-Time Analytics and Centralized Logging
Centralized logging pulls data from containers, virtual machines, and cloud services into one interface, eliminating the hassle of juggling multiple tools. For example, a single Kubernetes cluster can generate millions of logs per hour, making a unified view essential.
Real-time dashboards offer immediate insights into system performance and resource use. They help teams detect gradual issues - like database latency increasing from 40 milliseconds to 280 milliseconds - that might go unnoticed with isolated snapshots. This visibility enables teams to allocate resources before users experience any impact.
Observability pipelines also help manage costs by filtering out unnecessary data at the source. For instance, MindOrigin reduced its observability expenses by 75% in early 2026 by moving to a unified platform. This platform eliminated duplicate storage fees and consolidated logs, metrics, and traces into a single system.
"Modern observability isn't just about collecting data; it's about making that data actionable. Our goal... is to bridge the gap between IT and business goals by ensuring every byte stored serves a purpose."
– Laduram Vishnoi, Founder and CEO, Middleware
Structured JSON logging, with consistent field names, speeds up parsing and querying. Adding trace IDs to every log line creates a direct link between distributed requests and their logs, simplifying root cause analysis in complex environments.
Distributed Tracing and Alert Systems
Building on real-time insights, distributed tracing provides a deeper look into request flows, while intelligent alerts ensure quick responses. Distributed tracing maps the entire lifecycle of a request across microservices, containers, and serverless functions. By assigning unique Trace IDs and spans, it tracks inter-service communication and identifies the exact service causing delays or errors. This comprehensive view is crucial, especially when modern web applications rely on 10–30 external services.
| Feature | Traditional Tracing | Distributed Tracing |
|---|---|---|
| Scope | Single process/monolith | Multiple services/distributed system |
| Focus | Single-process execution | End-to-end request flow, inter-service communication |
| Visibility | Siloed, internal | Holistic, across system boundaries |
Alert systems need to distinguish real issues from noise. Intelligent alerting uses machine learning to understand "normal" system behavior and flag unusual patterns - like sudden spikes in errors or bursty network traffic - that static thresholds might miss. Severity-based routing ensures critical issues, such as payment processing failures, trigger immediate action, while lower-priority alerts are sent to tools like Slack.
Effective alerts include direct links to relevant logs, performance metrics, and step-by-step runbooks to speed up Mean Time to Recovery (MTTR). Multi-location confirmations reduce false positives by ensuring alerts are triggered only when issues are verified across multiple geographic locations. Companies with strong observability practices can cut incident resolution times by up to 50%.
"I don't want my developers staying up all night digging through logs to fix issues; that's a waste of everyone's time. Middleware saves at least an hour of my time every day, allowing us to focus on building rather than searching."
– Akshat Gupta, Manager of Engineering Operations, Trademarkia
Monitoring Performance Metrics and SLAs
Effective monitoring of performance metrics and SLAs is the backbone of maintaining system reliability. By leveraging real-time analytics and distributed tracing, you can ensure your platform operates smoothly under varying loads. Central to this effort are the Four Golden Signals - latency, error rate, throughput, and saturation. These metrics are essential for assessing system health and meeting Service Level Agreements (SLAs), which are your formal commitments to customers regarding uptime and performance.
Understanding the difference between SLI (Service Level Indicator), SLO (Service Level Objective), and SLA (Service Level Agreement) is key. Think of SLIs as the raw measurements, like your current uptime percentage. SLOs represent your internal targets, such as achieving 99.95% uptime, while SLAs are the external promises made to customers, often with financial penalties for non-compliance, typically set at 99.9% uptime. Setting your SLOs more conservatively than your SLAs creates a buffer, allowing you to address issues before they escalate into SLA breaches.
Why does this matter? Downtime can be incredibly costly. For example, a 99.9% uptime SLA translates to just 43.8 minutes of downtime per month, or 8.77 hours annually. Achieving "five nines" (99.999%) availability narrows this to a mere 5.26 minutes per year.
Key Metrics to Track in Middleware
Monitoring middleware performance involves tracking specific metrics that reveal potential bottlenecks or failures. Here’s what you should focus on:
- Latency percentiles: Averages often mask problems. Metrics like p95 and p99 help identify "tail latency" issues that affect your most active users. For instance, maintaining a p95 latency under 500 milliseconds is considered excellent.
- Error rates: Breaking down errors into client-side (4xx codes) and server-side (5xx codes) categories helps pinpoint their origin. Since APIs drive about 83% of all web traffic, keeping server-side error rates below 0.1% is critical.
- Saturation metrics: These show how close your system is to hitting capacity. Keep an eye on CPU usage, memory, database connections, and disk I/O. Alerts should trigger when resources hit 70-80% utilization, giving you time to scale and avoid failures.
| Metric Category | Key Indicators | Target/Threshold Example |
|---|---|---|
| Resource | CPU, RAM, Disk I/O, Swap Usage | CPU < 80% sustained |
| Performance | p50, p95, p99 Latency, Throughput (RPS) | Simple Read p99 < 500ms |
| Reliability | 5xx Error Rate, Uptime, Apdex Score | 5xx Rate < 0.1% |
| Saturation | DB Connections, Message Queue Depth | DB Pool < 80% active |
These metrics not only provide a snapshot of current performance but also define error budgets, which help balance reliability with development speed. For example, if your SLO is 99.9%, your error budget is 0.1%, or about 43.8 minutes of downtime per month. Once this budget is exhausted, teams should shift focus from adding features to stabilizing the system.
Meeting SLA Requirements Through Monitoring
Middleware monitoring plays a critical role in verifying SLA compliance and providing data for incident analysis. This is especially important when handling service credit requests or investigating outages that affect customer operations.
- Alert on symptoms, not causes: Focus alerts on user-impacting issues like high error rates or p99 latency exceeding 2 seconds. This approach reduces unnecessary alerts and ensures teams respond only to real problems.
- Multi-region verification: Perform checks across multiple regions to differentiate between global outages and localized problems, minimizing false alarms.
- Synthetic transactions: Go beyond basic HTTP 200 checks by simulating user journeys with scripted tests. This helps identify failures that might otherwise go unnoticed, particularly in multi-tenant systems. For enterprise customers, tenant-specific health endpoints are crucial to ensure contracted reliability levels.
"Improving API response time by just 100ms increased our customer retention by 3.2% and reduced support tickets by 12%."
– Mid-market SaaS Founder
The financial stakes are high. A single hour of downtime costs 98% of companies around $100,000. Middleware monitoring turns SLA commitments into actionable goals, protecting both customer trust and revenue. Up next, we’ll dive into the architectural patterns that support scalable middleware.
Architecture Patterns for Scalable Middleware
The architecture of your middleware plays a critical role in how well your system handles growth. While monitoring tools can help identify problems, the underlying architecture determines whether your system can scale smoothly or becomes a bottleneck. The choices you make now can either pave the way for seamless expansion or lead to costly overhauls when traffic surges unexpectedly.
One of the most effective strategies is moving from point-to-point integrations to a centralized Integration Hub Pattern. Instead of maintaining a tangled web of direct connections, this approach creates a unified middleware layer that serves as a single source of truth for tasks like transformation, error recovery, and orchestration. For example, third-party APIs often have quirks like inconsistent rate limits. With an integration hub, these differences can be treated as configuration data rather than hardcoded logic. Your middleware could normalize rate limit headers from platforms like Salesforce, HubSpot, and Shopify into a consistent format, such as ratelimit-remaining, making it easier for your core applications to handle.
Another critical design is the Unified Webhook Receiver, which simplifies handling various verification schemes (e.g., HMAC, JWT, and Basic Auth) and transforms raw payloads into a consistent event format. This is especially useful when providers limit your application to a single webhook URL. Middleware can inspect payloads for tenant-specific identifiers like company_id, duplicate the event, and route it asynchronously to the appropriate queue using a Fan-Out Architecture. This setup is crucial for minimizing downtime and costs, particularly when you consider that the median time to detect a webhook issue is 42 minutes, with each minute potentially costing $4,537. By normalizing inconsistencies and enabling redundancy, this architecture lays the foundation for a resilient system.
"Good middleware is invisible when it works and invaluable when problems arise. Invest in the architecture upfront, and your enterprise HubSpot implementation will scale smoothly."
– San Karunanithy, Solution Architect
Setting Up Redundancy and Load Balancing
A well-designed architecture goes beyond scaling - it also ensures reliability. Redundancy and load balancing are key to keeping your middleware operational during traffic spikes or outages. With an active-active configuration, multiple middleware instances run simultaneously, sharing the workload. If one instance fails, the others continue processing without interruption. For systems with predictable traffic patterns, an active-passive setup might be a more cost-effective choice, as standby instances only activate when the primary fails.
Load balancing distributes incoming requests across multiple servers, preventing any single node from becoming overwhelmed. This is especially crucial as APIs now account for 57% of all dynamic internet traffic, and 82% of organizations are adopting an API-first strategy by 2025. Depending on your workload, you can opt for strategies like round-robin, least-connections, or weighted load balancing.
Reliability also hinges on decoupling and buffering. Message queues like Kafka or SQS separate producers from consumers, allowing your middleware to quickly acknowledge HTTP requests while offloading time-intensive tasks to worker processes. This setup enables worker scaling based on queue depth, ensuring your system can handle demand without over-allocating resources. Additionally, acknowledgment models in message queues ensure that if a worker crashes mid-task, the job is re-queued rather than lost. However, this makes it essential to design job processors to be idempotent - processing the same task multiple times should yield the same result. To handle jobs that exceed retry limits, implement Dead Letter Queues (DLQ) to prevent them from clogging your main pipeline.
Using Asynchronous Communication and Message Queues
Asynchronous communication is another vital element for scalability. Instead of waiting for downstream services to respond, your system can send a message and move on immediately. This temporal decoupling allows services to operate independently, accommodating maintenance windows and managing temporary network issues gracefully.
Message queues excel at smoothing out traffic spikes. For instance, during a flash sale, when order volume might increase tenfold, the queue absorbs the surge, allowing workers to process tasks at a manageable pace. Brokers persist messages to disk, ensuring they aren't lost even if a consumer crashes or the system restarts.
Choosing between RabbitMQ and Kafka depends on your needs. RabbitMQ excels in task-based workflows, featuring flexible routing and message deletion after acknowledgment. Kafka, on the other hand, is designed for event-based systems, retaining messages in an append-only log that can be replayed, making it ideal for high-throughput scenarios. For context, Kafka can handle around 1,000,000 messages per second, while RabbitMQ typically manages between 4,000 and 10,000.
"RabbitMQ thinks in tasks, Kafka thinks in events."
– Kanavpreet Singh
When dealing with payloads larger than AWS SQS's 256KB limit, the Claim-Check Pattern can be a lifesaver. Store the raw data in object storage like S3 and pass a lightweight pointer through the queue. This keeps your message broker fast while still accommodating large datasets. Monitor queue depth closely; a growing queue signals that consumers can't keep up, which may require scaling workers. To reduce synchronized retry traffic spikes, add randomness (or "jitter") to exponential backoff intervals - a technique that has been shown to cut these spikes by over 80% in production systems.
Monitoring Middleware in Multi-Tenant SaaS Systems
When it comes to multi-tenant systems, monitoring takes on a whole new level of complexity. Unlike single-tenant setups, issues in a multi-tenant architecture can be tenant-specific, even when overall system availability looks fine. This can be especially problematic for high-value customers. The middleware layer, sitting at the heart of these systems, presents an ideal spot to track tenant-specific issues - provided that tenant context is captured right from the beginning.
"Global uptime numbers hide tenant-specific failures. And in multi-tenant architectures, those hidden failures are the ones that churn your highest-value customers." – Webalert Team
A common culprit behind these issues? Resource contention. Whether it’s a "noisy neighbor" hogging CPU or memory, database queries flooding connection pools, or message queues overwhelmed by event spikes, shared resources can quickly become bottlenecks that impact specific tenants. Addressing these challenges starts with precise tenant tracking and smarter service discovery.
Tenant-Specific Monitoring and Service Discovery
The first step is extracting tenant context early in the process. This can be done using methods like JWT claims, API keys, or subdomains. Once captured, this tenant identifier must travel through your system - across HTTP calls, message queues like Kafka or RabbitMQ, and asynchronous workflows.
To make this happen, OpenTelemetry’s Baggage mechanism is incredibly useful. It attaches tenant metadata to W3C headers, ensuring that every service along the way knows which tenant it’s dealing with.
But there’s another challenge: the sheer volume of data generated by monitoring multi-tenant systems. Imagine a platform serving 10,000 tenants across 50 API endpoints. Tracking latency for each tenant would result in 500,000 unique time series. To manage this, you can implement tiered aggregation. For example, you might monitor detailed metrics for your top 100 enterprise customers while grouping the remaining 9,900 tenants into a single aggregated metric like "aggregated_free_tier."
Different customer tiers also require tailored monitoring strategies. Enterprise customers often demand 99.95% availability and sub-300ms latency, while free-tier users might be fine with 99.5% availability and latency under 1,000ms. Sampling policies should reflect these priorities. For instance:
- Capture 100% of traces for enterprise users.
- Sample 20% of traces for mid-tier customers.
- Limit free-tier sampling to 5%.
| Tier | Availability SLO | Latency Target (p95) | Trace Sampling |
|---|---|---|---|
| Enterprise | 99.95% | < 300ms | 100% |
| Pro | 99.9% | < 500ms | 20% |
| Free | 99.5% | < 1,000ms | 5% |
Resource consumption should also be monitored on a per-tenant basis. Metrics like database query rates, active requests, CPU usage, and memory allocation need to be tracked by tenant. If a tenant exceeds their resource quota or starts affecting others, automated throttling or alerts can help maintain service quality for everyone.
Cloud-Native Monitoring and OpenTelemetry Integration
OpenTelemetry has become the go-to standard for cloud-native observability, offering platform-agnostic tools to collect and route telemetry data. This flexibility is particularly valuable for multi-tenant systems, where different customers may have unique requirements for data residency or retention.
The OpenTelemetry Collector acts as a central hub, directing traces, metrics, and logs to specific backends based on tenant attributes. For instance, enterprise customer data might be sent to a high-retention backend, while data from shared tenants goes to standard storage. This setup not only meets data isolation needs but also helps control costs.
"Tenant isolation in observability is not just about filtering. It is about building a system where tenant context flows through every layer of your telemetry pipeline." – Nawaz Dhandala, Author, OneUptime
To streamline this process, use a SpanProcessor to automatically inject tenant identifiers into each trace. This ensures consistency and reduces the risk of missing critical context.
Cloud provider integrations add another layer of functionality. For example, AWS Distro for OpenTelemetry (ADOT) can annotate X-Ray traces with tenant-specific details. This allows telemetry from multiple AWS accounts to merge into a single control plane, which is particularly handy for SaaS platforms with dedicated infrastructure per tenant.
Lastly, don’t overlook the health of your observability pipeline itself. Monitor metrics like otelcol_processor_routing_items_routed and otelcol_exporter_send_failed_spans. If routing logic fails or exporters drop data, you could lose visibility at critical moments. Treat your observability tools as first-class systems with their own SLAs to maintain trust in your monitoring data.
How Vestal Hub Supports Middleware Monitoring and SaaS Scaling
Vestal Hub takes middleware performance to the next level, providing the tools and expertise needed to support SaaS growth while addressing the challenges of monitoring and scaling multi-tenant systems.
For B2B SaaS companies that rely on middleware to connect their tech stacks, Vestal Hub offers specialized RevOps services. Their focus is on creating unified data architectures that link disconnected systems into a single source of truth. This approach eliminates blind spots in complex environments, ensuring smoother operations and better visibility - key elements for scalable growth.
The process kicks off with an Initial Audit & Diagnosis, identifying inefficiencies and bottlenecks in the integration layer before they can disrupt operations. This proactive step ensures potential issues are addressed early. Vestal Hub excels in building custom API integrations and managing third-party connections. They specialize in linking HubSpot with enterprise tools like ERPs or custom applications, ensuring seamless communication between systems.
"Vestal Hub consistently delivers comprehensive integration solutions... they've helped us setup countless integrations between our HubSpot CRM and our clients varying CRMs." - Jennifer Sales, Chief Revenue Officer, Select Software Reviews
Their Enterprise Plan, priced at $4,900 per month, is tailored for high-growth businesses that demand strong middleware integration and ongoing support. This plan includes 60 hours of monthly support, allowing up to three tasks to run simultaneously. Most requests - whether troubleshooting or system optimizations - are resolved in two days or less.
Vestal Hub also refines workflows to prevent bottlenecks in multi-tenant systems. Their lifecycle automation features, like PQL triggers, churn-risk alerts, and automated renewal pipelines, ensure operational efficiency remains intact. By continuously improving workflows, they not only solve immediate problems but also lay a stronger foundation for future SaaS scaling. With the cost of maintaining custom integrations ranging from $50,000 to $150,000 per connector annually, Vestal Hub’s centralized expertise offers a more efficient and stable alternative as platforms grow.
These solutions demonstrate how Vestal Hub seamlessly integrates middleware monitoring with SaaS growth strategies, helping businesses scale with confidence.
Conclusion
Middleware monitoring plays a crucial role for SaaS companies looking to grow while maintaining system reliability. By integrating logs, metrics, and traces into a single platform, teams can avoid the inefficiency of juggling multiple tools and minimize the time spent troubleshooting during outages. With a focus on actionable data rather than noise, middleware monitoring not only improves reliability but also helps reduce unnecessary expenses.
The operational benefits are clear and measurable. For example, when Hotplate experienced a surge in traffic in April 2026, their real-time monitoring setup, led by Founding Engineer Rangaraj Tirumala, achieved a 90% reduction in system latencies and made it 75% faster for the team to identify root causes. This translates to fewer emergencies and more time for productive development work.
"I don't want my developers staying up all night digging through logs to fix issues; that's a waste of everyone's time. Middleware saves at least an hour of my time every day, allowing us to focus on building rather than searching."
- Akshat Gupta, Manager of Engineering Operations, Trademarkia
The key takeaway is simple: proactive monitoring identifies problems before users even notice them. From catching infinite retry loops in under 30 seconds to stopping API abuse within minutes, automation handles the heavy lifting. For multi-tenant SaaS platforms, isolating tenant-specific spikes ensures that performance issues don't ripple across the system. Tools like distributed tracing, real-time alerts, and smart filtering create a safety net that supports growth without compromising quality.
Ultimately, middleware monitoring serves as the bridge between technical stability and business success. It ensures issues are resolved quickly, maintains high standards for system performance, and supports scalability - all of which are essential for driving user retention and revenue growth.
FAQs
What middleware should I monitor first?
Start by keeping a close eye on the core integrations and APIs that are vital to your SaaS operations. These include systems managing user authentication, data exchange, and payment processing - all crucial for maintaining stability and performance. To stay ahead of potential issues, track data flow using logs, traces, and metrics. This not only boosts visibility but also helps you respond more effectively to incidents. Over time, you can broaden your monitoring efforts to include other middleware components, which can help improve your system's scalability and reliability.
How do I pick good SLOs for my SaaS?
When setting up Service Level Objectives (SLOs) for your SaaS platform, it’s important to define precise, measurable targets that align with what your customers expect. The key is to focus on metrics that matter most, such as uptime, latency, error rates, and resource utilization. These metrics directly impact the user experience and provide a clear picture of your service's performance.
To stay ahead of potential problems, consider making your internal SLOs stricter than your contractual Service Level Agreements (SLAs). This way, your team can identify and fix issues before they affect customers.
Lastly, don’t let your SLOs become static. Regularly review their performance against real-world data and adjust them as needed. This ongoing refinement helps maintain system reliability and keeps your customers happy.
How do I monitor per-tenant performance without huge costs?
To keep track of tenant performance without overspending, consider using tenant-aware observability techniques. By integrating tools like OpenTelemetry into your SaaS application, you can tag telemetry data with tenant-specific details. This approach ensures accurate monitoring and helps track SLAs more effectively, all while avoiding the need to store excessive data.
In addition, implementing a middleware observability pipeline can make a big difference. This pipeline filters out irrelevant data, focusing only on actionable insights. The result? You maintain clear visibility into tenant performance while keeping costs under control.