Get insights like this delivered to your inbox
Join 2,500+ GTM professionals. No spam, unsubscribe anytime.
Subscribe to NewsletterWant real-time insights from your HubSpot data? Learn how to create dashboards that update every 30-60 seconds, empowering your team to make informed decisions without delay. This guide breaks down the process into 5 simple steps, covering everything from setting up your dashboard to integrating high-frequency data sources and optimizing performance.
Key Takeaways:
- Set Up Access: Ensure you have the right HubSpot subscription (Professional or Enterprise) and permissions to create dashboards.
- Connect Data Sources: Combine HubSpot CRM data with external tools like Google Sheets or Snowflake for more dynamic reporting.
- Focus on Real-Time Updates: Use activity metrics (calls, emails, meetings) and filters for live insights.
- Customize Visuals: Choose the right charts, tables, and filters to make data easy to understand.
- Share and Improve: Assign role-based permissions, organize dashboards, and regularly review for relevance.
By following these steps, you'll build dashboards that keep your team aligned and responsive to changes in real time.
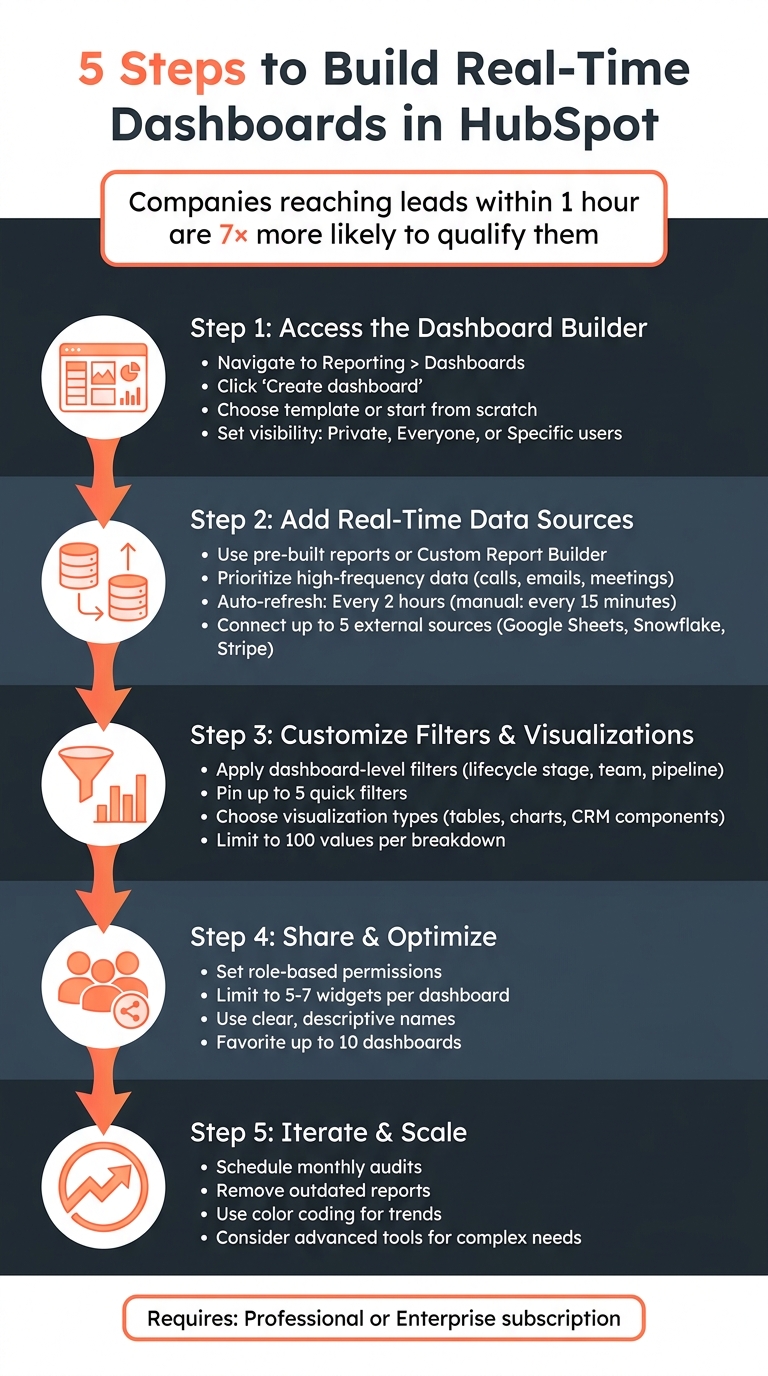
5 Steps to Build Real-Time HubSpot Dashboards
Prerequisites for Building Real-Time Dashboards
Verify HubSpot Access and Permissions
Your access to HubSpot's dashboard features depends on your subscription tier. To use the custom report builder and analytics suite across Marketing, Sales, Service, Content, and Commerce Hubs, you'll need a Professional or Enterprise subscription. If you're planning to sync data from external sources like Snowflake or Google Sheets, a Data Hub Professional or Enterprise subscription is required to utilize Data Studio.
Permissions are just as important as subscriptions. Your account administrator must enable "Create/own" and "Edit report" permissions for users working on custom reports. Super Admins can check these settings by navigating to user settings and ensuring the "Reports & dashboards" toggle is activated under reporting permissions. Without these permissions, the "Create dashboard" option won’t appear under Reporting > Dashboards.
Identify Data Sources and Integrations
Start by identifying the data sources for your dashboard. HubSpot's custom reports allow you to combine data from CRM objects like contacts, companies, and deals with activity data such as calls, emails, and meetings. This flexibility enables more comprehensive reporting compared to single-object reports.
If you're integrating external data, HubSpot’s Data Studio supports connections to third-party tools like Stripe, cloud data warehouses such as Snowflake, and productivity platforms like Google Sheets and AirTable. You can connect up to five data sources per dataset. For seamless integration, ensure columns such as email addresses or domains match across systems.
For more complex requirements, native tools might not be enough. In such cases, advanced solutions come into play.
Consider Advanced Solutions for Data Syncing
Sometimes, HubSpot’s built-in tools fall short, especially for teams that need faster updates or more intricate data setups. While HubSpot refreshes data every two hours and allows manual updates every 15 minutes, some organizations require real-time synchronization. Vestal Hub offers custom integration services that enable real-time syncing across multiple platforms, ensuring your dashboards always display the latest information. These advanced solutions are ideal for managing large datasets or keeping distributed teams aligned with live metrics. By reducing latency, these tools ensure your dashboard reflects up-to-the-minute data, aligning with the real-time insights discussed in this guide.
sbb-itb-69c96d1
Step 1: Access the Dashboard Builder and Set Up the Framework
Navigate to the Dashboard Builder
Start by logging into your HubSpot account. From there, go to Reporting > Dashboards. In the top-right corner, click Create dashboard to open the dashboard library. Alternatively, you can also access the library through Reporting > Reports.
Once you're inside the library, you'll have two options: use pre-designed templates or begin with a blank slate. Templates like "Sales Manager Dashboard" or "Marketing Lead Funnel" come with pre-filled reports that you can tweak to fit your needs. On the other hand, starting from scratch gives you full control to customize every detail of your dashboard.
"A dashboard in HubSpot is not just a place to view data. It's a real-time control panel that connects your CRM to performance insights." - Eric Smith, SmithDigital
After opening the dashboard builder, your next step will be to configure its name and access settings.
Define Dashboard Name and Visibility
Choose a clear and descriptive name for your dashboard, such as "Real-Time Sales Tracker". Avoid using URL characters or periods in the name.
Next, decide on the visibility settings based on who needs access to the dashboard. You can set it to Private, limiting access to yourself and your admins, or select Everyone to make it available to all users in the account. With the Everyone option, you can further specify whether users can have View only or View and edit permissions. If you're on an Enterprise plan, you can also restrict access to Only specific users and teams for more precise control. Keep in mind that the search tool for users and teams is case-sensitive, so use lowercase letters when searching.
Once your dashboard is created, you can make it your default by hovering over it in "Manage Dashboards" and selecting Set as default.
Step 2: Add and Configure Real-Time Data Sources
Choose Pre-Built Reports or Build Custom Reports
Start by filling your dashboard with data. Click Add report to choose from HubSpot's pre-built reports or create your own custom ones.
Pre-built reports are a quick way to access common metrics, like deals by stage, contact sources, or email performance, without much setup. But if you're looking for cross-object analytics - such as monitoring how target accounts (Companies) interact with your website (Activities) - you'll need the Custom Report Builder.
To use the custom builder, head to Reporting > Reports, click Create report, and select Custom report builder. From there, pick your primary data source and turn on "Add more data sources" to integrate other objects. HubSpot makes it easy to differentiate between data types: Dimensions (gray) show unaggregated details like names or dates, while Measures (green) represent aggregated figures like deal counts or revenue totals.
Custom reports refresh automatically every two hours, but you can manually refresh them every 15 minutes to get the latest data. Keep in mind that new data may take 10 to 15 minutes to appear in reports due to built-in latency.
Once you've set up your reports, focus on optimizing your dashboard with data that updates frequently.
Prioritize High-Frequency Data Sources
For a dashboard that's truly real-time, you'll want to include data that updates often. Activities like calls, emails, and meetings are great examples, as they change throughout the day based on your team's interactions with prospects.
Incorporate activity metrics alongside static properties in your custom reports to keep tabs on live engagement. For instance, tracking metrics like "Number of calls logged today" or "Meetings scheduled this week" can give you an up-to-the-minute view of your team's performance.
To keep your dashboard running smoothly, apply filters to focus your data. Use date filters like "Today" or "This week" to zero in on current activity. Also, non-table reports are limited to 1,000 unique rows for faster load times. If you're dealing with large volumes of data, narrowing the time range can help. For example, Enterprise subscriptions can handle up to 100 million events, but smaller time frames make your dashboards more responsive and actionable.
How to Create Dashboards in HubSpot | HubSpot Tutorial 2026
Step 3: Customize Filters, Visualizations, and Updates
Fine-tuning filters, visualizations, and update settings ensures your real-time dashboard stays accurate and actionable.
Apply Relevant Filters
Streamline your dashboard data with HubSpot's dashboard-level filters. These filters work across all single-object and cross-object reports linked to the same data source, helping you zero in on what’s most important.
To set up advanced filters, head to Reporting > Dashboards, select Advanced filters, and click + Add filter. You can then refine your data by properties like lifecycle stage, team, or deal pipeline. Keep in mind that these filters use "AND" logic with report-level filters, and they’ll override report-level filters if both target the same property.
For convenience, use the Quick filters tab to pin up to five frequently used properties at the top of your dashboard. This feature is especially handy for teams that need to switch between views quickly. You can also group similar properties - like "Deal Close Date" and "Deal Create Date" - into a single quick filter, keeping your dashboard tidy. Dynamic quick filters, such as "Owners" or "Date range", automatically adjust based on the reports in your dashboard, ensuring your data stays consistent.
Additionally, dashboard URLs automatically update with applied filters, making it easy to share specific views with your team.
Once your filters are in place, it’s time to choose visualizations that best showcase your refined data.
Select Visualization Types
Picking the right visualization format can make your data easier to understand at a glance. For example:
- Use tables when you need sorting and search functionality.
- Opt for CRM components for property-based filtering.
Be aware that HubSpot dashboards won’t load reports with more than 100 values in the "Break down by" property. If you encounter a "Too many data points requested" error, try narrowing your breakdowns or applying additional filters to reduce the data volume. You can also add notes - including text, images, or videos - to provide context for your metrics, but remember these count toward your dashboard's report limit.
To dive deeper into your data without cluttering the main view, consider using interactive overlays like modals, tabs, or panels.
Enable Auto-Refresh for Near-Real-Time Updates
Keeping your data up-to-date is just as important as filtering and visualizing it.
HubSpot dashboards follow a fixed refresh schedule. If you need more recent data, you can manually refresh individual reports or the entire dashboard. Simply hover over a report, click the three vertical dots icon, and select Refresh. Manual refreshes can only be done once every 15 minutes.
"The interval is 2 hours, can be forced every 15 minutes (manually) but cannot be adjusted." - Karsten Köhler, HubSpot Freelancer & Community Hall of Famer
For dashboards pulling data from external sources like Google Sheets via Data Studio, data ingestion can occur as often as every five minutes. However, the reporting layer still adheres to HubSpot’s standard two-hour automatic refresh cycle. This means HubSpot reports should be treated as "near-real-time" rather than "live", with delays ranging from 15 minutes to two hours depending on the reporting tools in use. If your data seems outdated, check for issues like broken connections, expired permissions, or errors in the source spreadsheet formulas.
Step 4: Share and Optimize Dashboards
Once you've set up real-time updates, the next step is to make your dashboard accessible and ensure it performs efficiently. This involves managing access permissions and fine-tuning its usability.
Set Role-Based Permissions
HubSpot provides several options for controlling dashboard access: Private, Everyone (with either "View only" or "View and edit" permissions), or restricted access for Enterprise users.
If you're a Super Admin or have "Reports & dashboards" permissions, you can view and edit any dashboard, regardless of its visibility settings. For Enterprise accounts, custom Roles can be created to manage permissions for groups (e.g., Sales Representatives or Business Analysts), saving time compared to configuring access for individual users.
To adjust permissions for an existing dashboard, go to Reporting > Dashboards, click Manage dashboards, hover over the desired dashboard, and choose Manage access from the Actions dropdown. If you need to track changes, the Activity log under the Actions menu provides a history of modifications.
Once permissions are set, focus on organizing dashboards to improve collaboration and accessibility.
Organize Dashboards for Easy Access
Give your dashboards clear, descriptive names (like "Q2 Sales Pipeline") and add concise descriptions to make them easier to identify.
HubSpot allows you to favorite up to 10 dashboards by clicking the star icon next to their names. You can also designate one dashboard as your Default, so it automatically appears when you log in or click the HubSpot sprocket icon. For easy sharing, use the Copy URL or Email this dashboard options to send specific views to your team.
Test and Optimize Performance
After setting up your dashboards and configuring data, it's important to test their performance. Real-time responsiveness depends on the volume of data being processed. If you encounter an error like "Too many data points requested", try narrowing down the data breakdowns or applying filters to reduce the load. If performance issues persist, you can book a technical call to audit your data architecture.
Step 5: Iterate and Scale for Advanced Features
Once your dashboard is shared and optimized, the next step is to fine-tune and expand it to meet your business's evolving needs.
Regularly Review and Update Dashboards
Dashboards aren't static - they need periodic updates to stay relevant. Adjust them as your business metrics shift over time.
To keep things clear and actionable, limit each dashboard to 5–7 widgets. This ensures your data tells a concise story, as Nikias Kray from CRM Magnetics explains:
A good dashboard tells a story at a glance.
Remove outdated reports to avoid clutter, or duplicate high-performing ones to track new metrics quickly. If necessary, add contextual elements to make the data more meaningful.
Take advantage of workflow triggers to receive real-time alerts when specific metrics are hit - like when a high-value lead visits your pricing page. Additionally, use color coding to group related data and highlight trends, making it easier to spot patterns and performance shifts.
Use Advanced Tools for Scaling
As you refine your dashboards, you might reach a point where native tools no longer meet your needs. This is where advanced tools come into play, allowing you to scale and enhance your dashboard's functionality.
The HubSpot Developer Platform offers a range of options, such as React-based UI extensions, custom apps, App Cards (custom widgets), and Agent tools. These tools can query databases and handle complex data operations, giving you the flexibility to overcome limitations in HubSpot's native setup.
For businesses like B2B SaaS companies managing extensive, cross-functional data, Vestal Hub provides tailored solutions. They specialize in creating unified data architectures with real-time syncing, custom integrations, and cross-object reporting dashboards (https://vestalhub.com). Their expertise includes middleware, API endpoints, and custom CRM interfaces, enabling advanced features like predictive revenue modeling, automated onboarding workflows, and role-based views - all without hitting HubSpot's built-in constraints.
Conclusion
Creating and maintaining real-time dashboards involves careful planning, thoughtful customization, and ongoing refinement. Start by verifying access, pinpointing key data sources, and building a structured framework for your dashboard. From there, incorporate the real-time data most relevant to your business, customize filters and visuals for clarity, and assign role-based permissions to ensure the right people see the right information.
"A static dashboard is a silent risk. Business priorities shift, campaigns change, and real-time data evolves fast".
To keep your dashboards actionable, schedule monthly audits. These reviews help ensure the data remains aligned with your goals. If basic tools don’t meet your needs, advanced reporting solutions may be the answer.
When managing complex, cross-system data, native HubSpot features can sometimes fall short. This is where advanced reporting tools, like those offered by Vestal Hub, come into play. Vestal Hub specializes in creating tailored, real-time integrations and scalable dashboards. Their RevOps expertise supports B2B SaaS companies with unified data architectures, custom reporting dashboards, and advanced capabilities like cross-object reporting, external data integration, and predictive revenue modeling. These features go far beyond standard templates (https://vestalhub.com).
Real-time dashboards also play a key role in improving lead qualification. Research shows that companies reaching out to inbound leads within an hour are nearly 7 times more likely to qualify them compared to those that delay. By providing timely, accurate data, these dashboards enable teams to respond faster and make informed decisions.
FAQs
How real-time are HubSpot dashboards, really?
HubSpot dashboards deliver real-time insights, with their native dashboards automatically refreshing every minute. These dashboards are also highly customizable, allowing you to tailor data visualizations and set up alerts based on your configuration and the data sources you've connected.
What data should I use for near-live updates?
For near-instant updates in your HubSpot dashboards, rely on data sources that connect directly to HubSpot and refresh in real time. Using HubSpot's built-in dashboards or custom dashboards powered by API integrations works best. These options allow for real-time visualizations and alerts, ensuring your metrics are always up-to-date and ready for action.
How do I fix 'too many data points' errors?
To address the "too many data points" errors in HubSpot dashboards, start by examining your data sources and how your reports are structured. Simplify things by reducing the number of filters or data points in your reports. You might also want to switch to single-object reports or activity tracking reports when possible. Double-check that your data integration and refresh settings are properly configured. These errors typically occur when the system is overloaded with too much data or when workflows or reports are not set up correctly.